![Aperture interference increases spatial resolution. (left) Conventional methods for recording spatio-angular samples of the light field: lenslet array, camera array, and image set captured with pinhole aperture masks [Wetzstein et al., 2011]. Simulated wave optics pixel back- projection illustrates loss of spatial resolution not apparent with ray optics analysis. (right) Interference of light passing through multiple regions of the aperture transmits high spatial frequencies, at the cost of degraded angular information. In this paper, we will show how extraneous angular information can be traded for improved spatial resolution while maintaining axial field of view.](http://www.computationalimaging.org/wp-content/uploads/2017/04/fig1.png)
Aperture interference increases spatial resolution. (left) Conventional methods for recording spatio-angular samples of the light field: lenslet array, camera array, and image set captured with pinhole aperture masks [Wetzstein et al., 2011]. Simulated wave optics pixel back- projection illustrates loss of spatial resolution not apparent with ray optics analysis. (right) Interference of light passing through multiple regions of the aperture transmits high spatial frequencies, at the cost of degraded angular information. In this paper, we will show how extraneous angular information can be traded for improved spatial resolution while maintaining axial field of view.
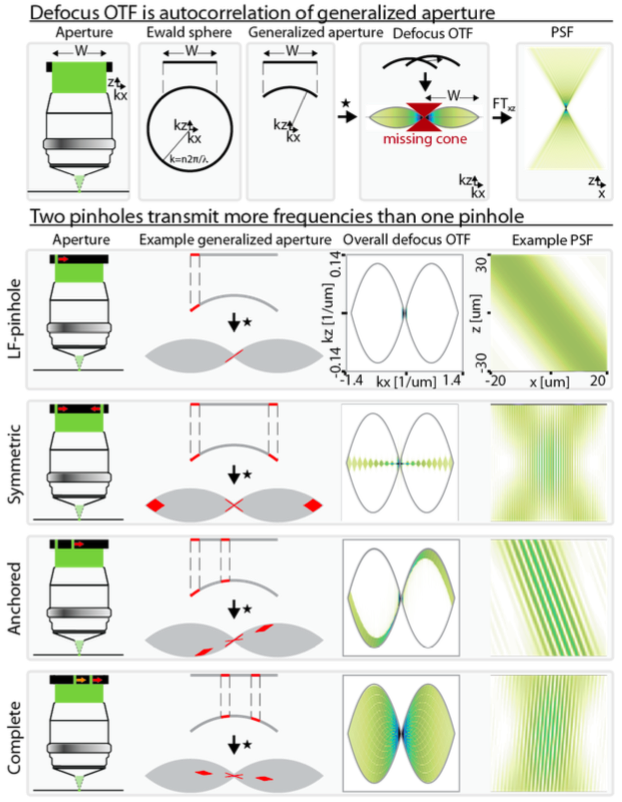
Defocus OTF as an analysis tool. Here we show the 2D x-z planar case. (top) The defocus OTF can be derived directly from an aperture mask, as the autocorrelation of the generalized aperture. The 3D PSF is the 3D Fourier transform of the 3D de- focus OTF. (bottom) Increased spatial frequency content is acces- sible with a two-pinhole aperture mask. First column schematizes each aperture sequence; second column demonstrates for an ex- ample mask the OTF coverage (in red) superimposed on the OTF of a fully open aperture (in gray); third column plots the overall defocus OTF coverage of the mask sequence; and fourth column shows the PSF corresponding to the example mask.
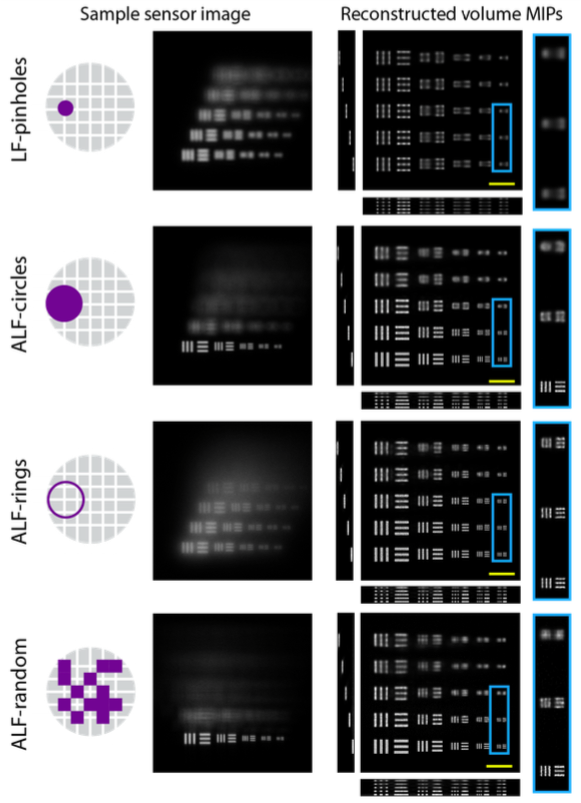
Simulation results showing the test volume, sample sensor images with Poisson noise for each of the aperture mask schemes, and maximum intensity projections (MIPs) of the re- constructed volumes. The volume (1024 ⇥ 1024 ⇥ 15) con- sisted of non-overlapping test resolution bars every third slice, with 6.67 μm between each slice. All scale bars measure 10 μm.
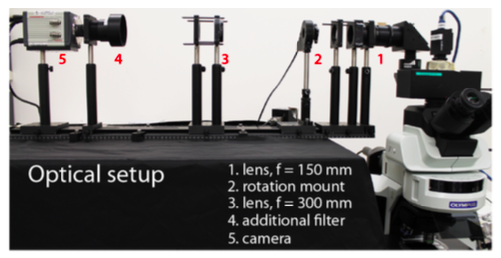
Optical setup: a standard epifluorescence micro- scope with a 4f relay system off the camera output port.
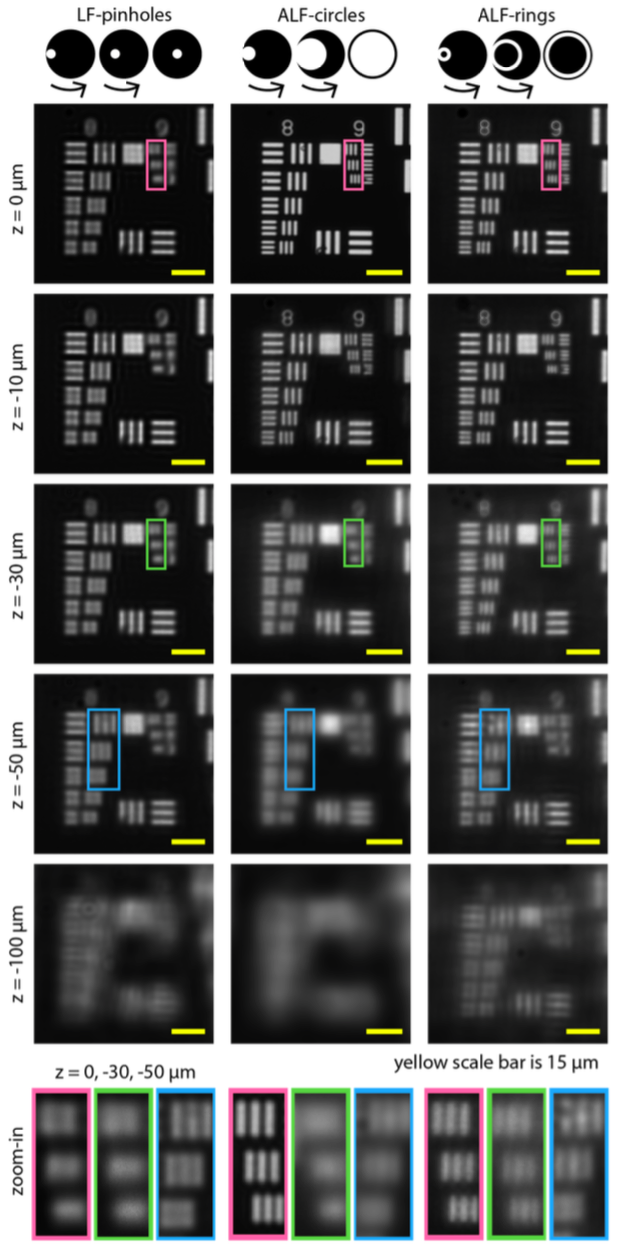
Experimentally captured single plane reconstruction of a USAF 1951 resolution chart (groups 8 and 9) at different defocus depths for LF-pinholes, ALF-circles, and ALF-rings. Scale bars 15 μm.