Deep Learning 3D Localization Microscopy | Optics Letters 2021

Deep learning multi-shot 3D localization microscopy using hybrid optical–electronic computing.

ABSTRACT

Current 3D localization microscopy approaches are fundamentally limited in their ability to image thick, densely labeled specimens. Here, we introduce a hybrid optical–electronic computing approach that jointly optimizes an optical encoder (a set of multiple, simultaneously imaged 3D point spread functions) and an electronic decoder (a neural network–based localization algorithm) to optimize 3D localization performance under these conditions. With extensive simulations and biological experiments, we demonstrate that our deep learning–based microscope achieves significantly higher 3D localization accuracy than existing approaches, especially in challenging scenarios with high molecular density over large depth ranges.

FILES


CITATION

H. Ikoma, T. Kudo, Y. Peng, M. Broxton, G. Wetzstein, Deep learning multi-shot 3D localization microscopy using hybrid optical-electronic computing, Optics Letters 2021.

@article{ikoma2021,
author = {Hayato Ikoma and Takamasa Kudo and Yifan Peng and Michael Broxton and Gordon Wetzstein},
title = {Deep learning multi-shot 3D localization microscopy using hybrid optical-electronic computing},
journal = {Optics Letters},
year={2021}
}


METHOD

Deep PSF - Teaser
(a) Illustration of the proposed system. The microscope uses a dichroic filter (DF) to split the illumination and detection paths. The detection path contains a spectral emission filter (EF), several lenses (L), a beam splitter (BS), a phase mask (PM) in each path, and a separate sCMOS sensor for each of these paths. (b) The phase profiles of the masks are jointly optimized with the neural network–based localization algorithm. (c) After fabrication and optical alignment in the microscope, we measure depth-dependent PSFs for each of the two optical paths. These PSFs optically encode the 3D locations of the emitters. (d) Sensor images captured with this optical encoder are processed by a CNN decoder that takes as input a sequence of 2D images from both sensors and computes a 3D volume of the localized emitters.


The 3D microsphere locations estimated from (a,b) using our method are shown in yellow. Each bead is captured with approximately 150,000 photoelectrons. The effective pixel size is 108 nm.

RESULTS

Deep PSF - Table
Localization performance for several fixed (top block) and end-to-end (EtoE) optimized (bottom block) PSFs. For this experiment, we simulated a target depth range of 5.0 um, a molecular density of 3.0 um-2, and an average photon count of 5,000. The tetrapod PSF is optimized for this experimental condition in advance. Each camera of biplane and 5-plane is focused on equidistant planes which are maximally spaced over 5 um. Our multi-shot E2E-optimized PSFs consistently outperform other single- or multi-shot PSF designs for common localization metrics, including Jaccard index, precision, and recall. All optimized PSFs have to make a trade-off between lateral and axial localization precision.


Deep PSF - Evaluation
We compare the localization performance (Jaccard index) of different fixed and end-to-end (EtoE) optimized PSFs for multiple depth ranges (1.5 um, 3.0 um, 5.0 um, 10.0 um) and emitter densities (0.3 um-2, 3.0 um-2) with the same mean photon counts of 5,000. In both the medium and high density conditions, our optimized multi-shot system outperforms all other approaches by a large margin, especially for larger depth ranges.


Deep PSF - Evaluation
Depth-dependent PSFs of our two optical paths over a range of 8 um. The top row shows the optimized simulations and the center row shows experimental measurements. A small amount of axial elongation is observed that is due to optical aberrations in the microscope. To compensate for this mismatch, we computationally fit a 3D PSF to our measurements, parameterized by an optically accurate wave propagation model, which is used to refine the localization network. The scale bar represents 2 um.


(a,b) Sensor images of a single frame of a time-lapse movie showing the dynamics of the cytoplasm of live cells. The scale bar represents 5 um. (c) Composite image of cell nucleus, cytoplasm, and microspheres captured through one of our DOEs. (d) Estimated trajectories of the microspheres inside the cells over 30 minutes with the interval of 30 seconds. Each bead is captured with approximately 150,000 photoelectrons. The effective pixel size is 108 nm. Different color represents different beads.

Related Projects

You may also be interested in related projects, where we apply the idea of Deep Optics, i.e. end-to-end optimization of optics and image processing, to other applications

  • Ikoma et al. 2021, Depth from Defocus with Learned Optics for Imaging and Occlusion-aware Depth Estimation, ICCP 2021 (link)
  • Wetzstein et al. 2020. AI with Optics & Photonics. Nature (review paper, link)
  • Martel et al. 2020. Neural Sensors. ICCP & TPAMI 2020 (link)
  • Dun et al. 2020. Learned Diffractive Achromat. Optica 2020 (link)
  • Metzler et al. 2020. Deep Optics for HDR Imaging. CVPR 2020 (link)
  • Chang et al. 2019. Deep Optics for Depth Estimation and Object Detection. ICCV 2019 (link)
  • Peng et al. 2019. Large Field-of-view Imaging with Learned DOEs. SIGGRAPH Asia 2019 (link)
  • Chang et al. 2018. Hybrid Optical-Electronic Convolutional Neural Networks with Optimized Diffractive Optics for Image Classification. Scientific Reports (link)
  • Sitzmann et al. 2018. End-to-end Optimization of Optics and Imaging Processing for Achromatic Extended Depth-of-field and Super-resolution Imaging. ACM SIGGRAPH 2018 (link)

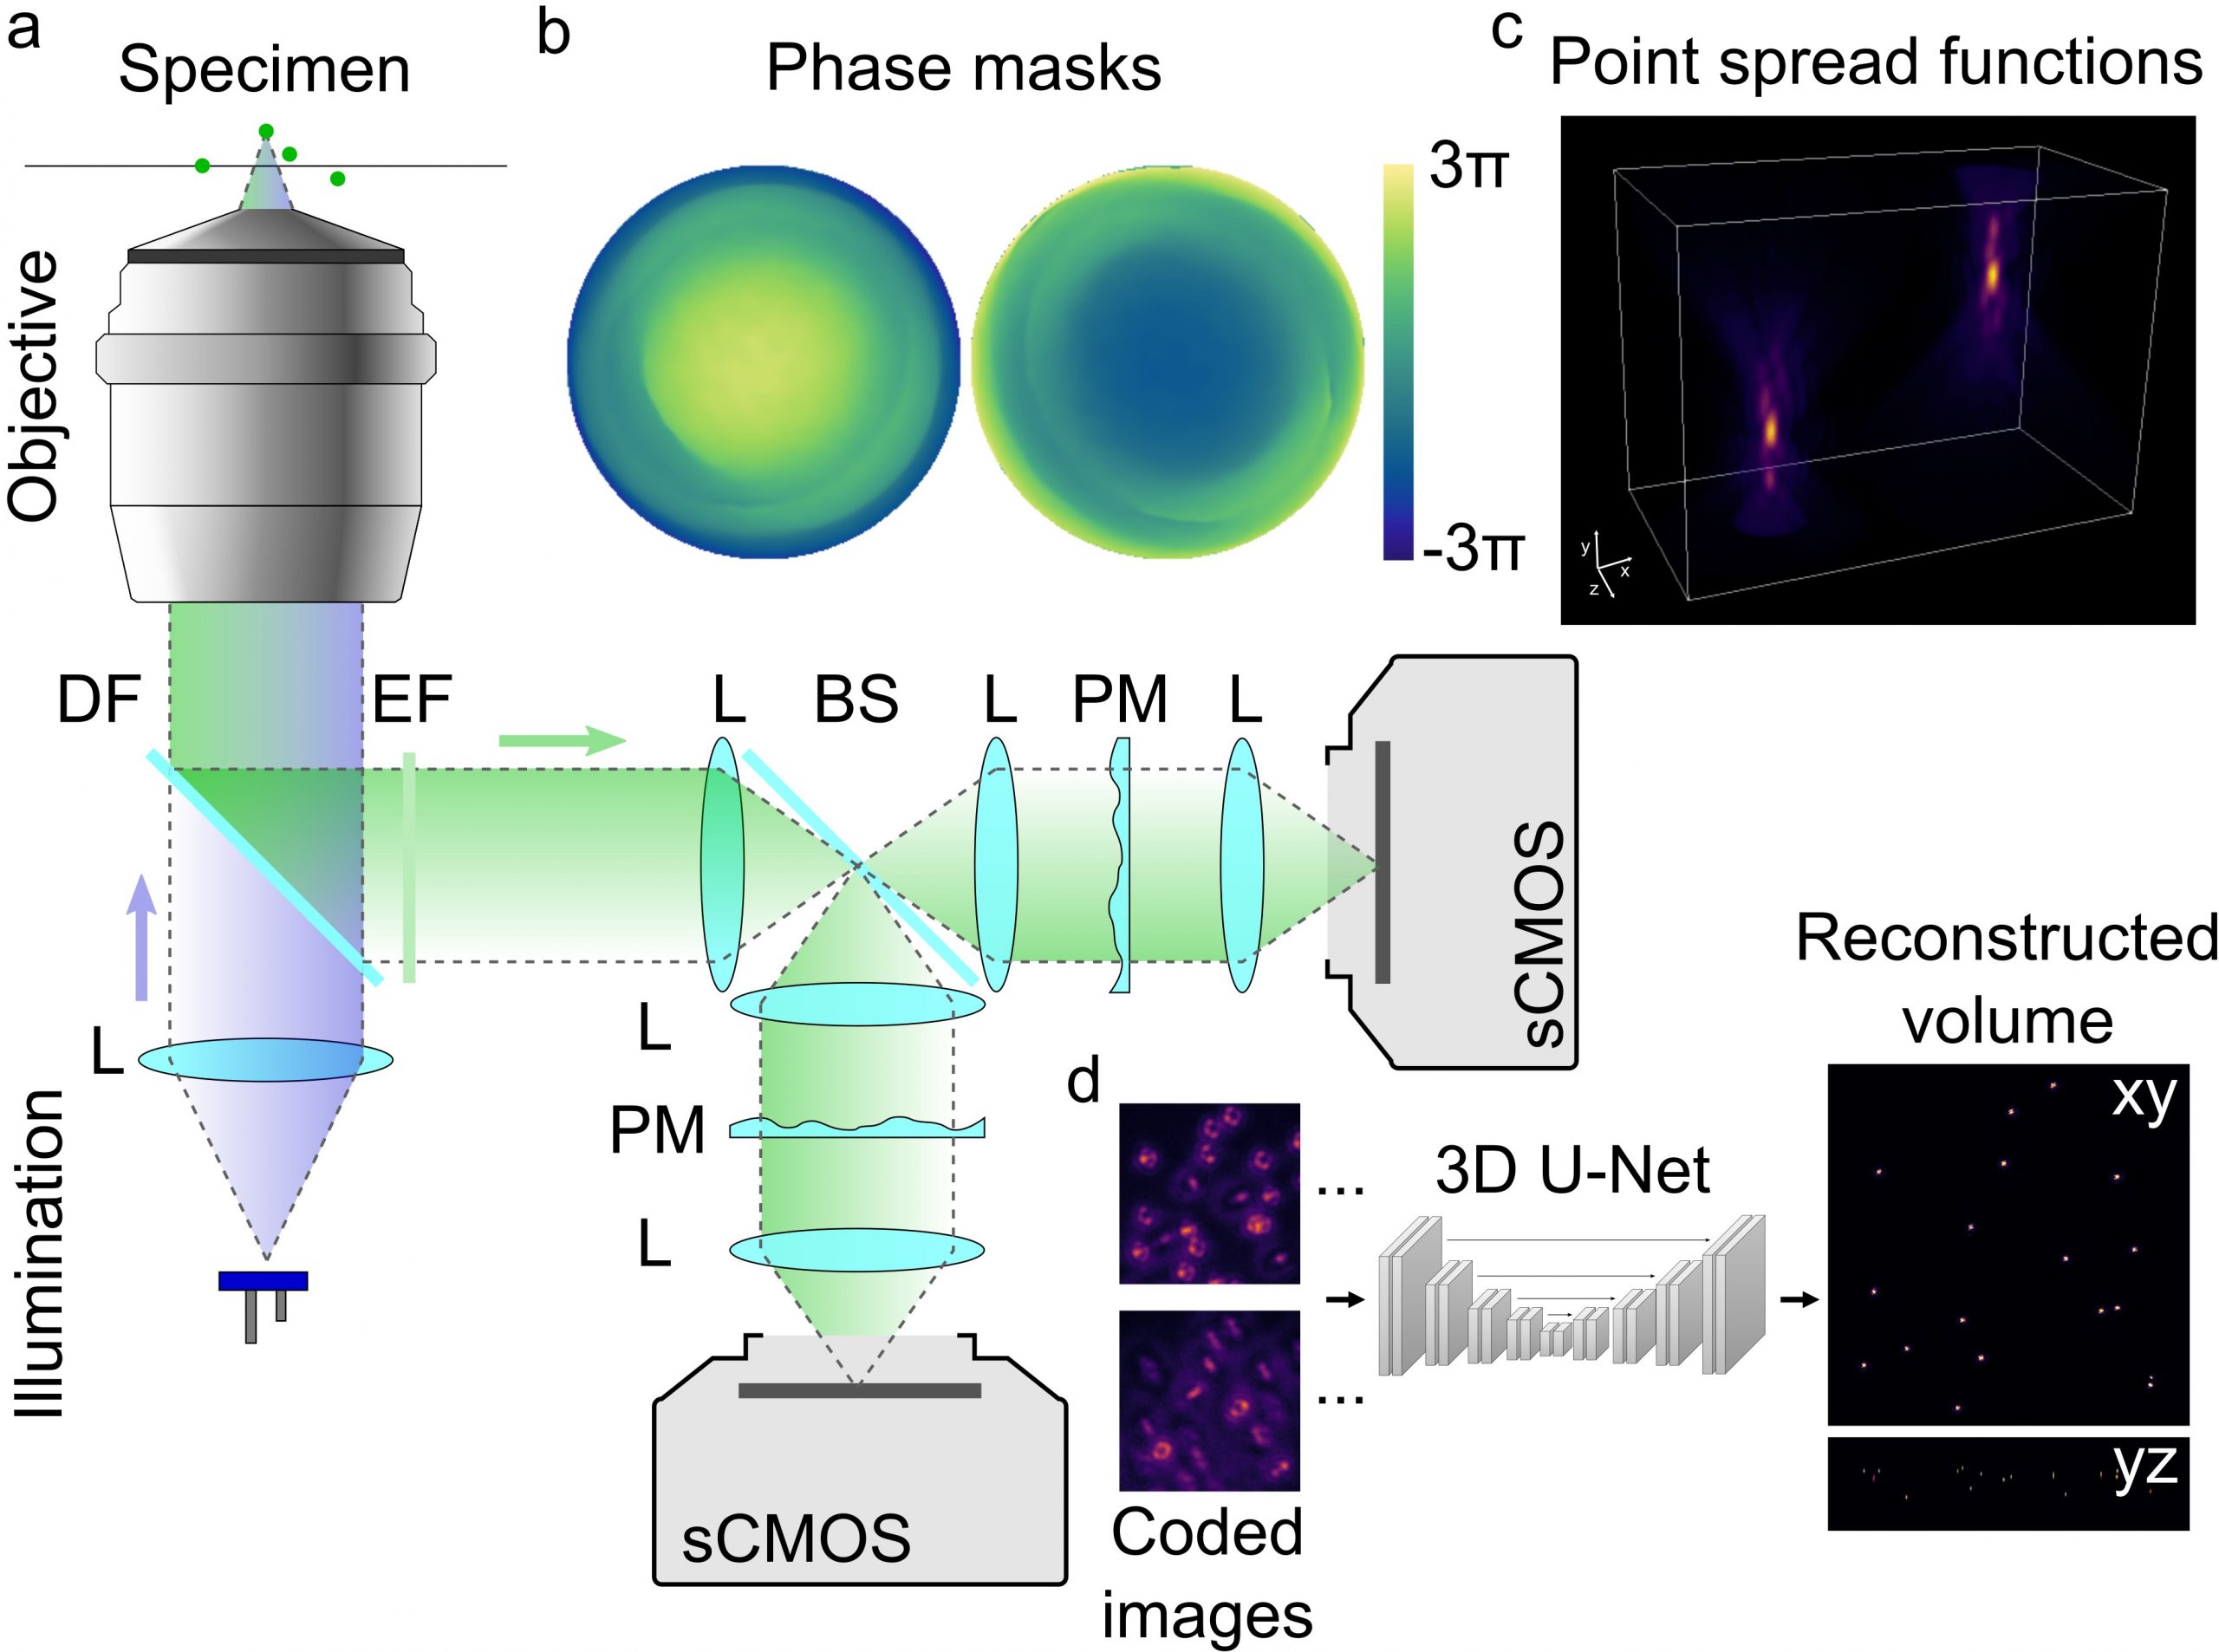
or project that focus on computational fluorescence microscopy

  • Kauvar et al. 2020, Cortical Observation by Synchronous Multifocal Optical Sampling Reveals Widespread Population Encoding of Actions, Neuron 2020 (link)
  • Ikoma et al. 2018, A convex 3D deconvolution algorithm for low photon count fluorescence imaging, Scientific Reports 2018 (link)
  • Prevedel et al. 2014, Simultaneous whole-animal 3D imaging of neuronal activity using light-field microscopy, Nature Methods 2014 (link)


ACKNOWLEDGEMENTS

We thank T. Carver, W.E. Moerner, A. Boettiger, J. Fleischer, M. Gehm, and H. Krovi for fruitful discussions. Part of this work was performed at the Stanford Nano Shared Facilities, supported by the NSF under award ECCS-2026822. This material is based upon work supported by DARPA under Agreement No. HR00112090123. This material is based upon work supported, in part, by the Defense Advanced Research Projects Agency (DARPA) under Agreement No. HR00112090123, a PECASE by the ARO, and Olympus Corporation.